Release date 1 July 2026
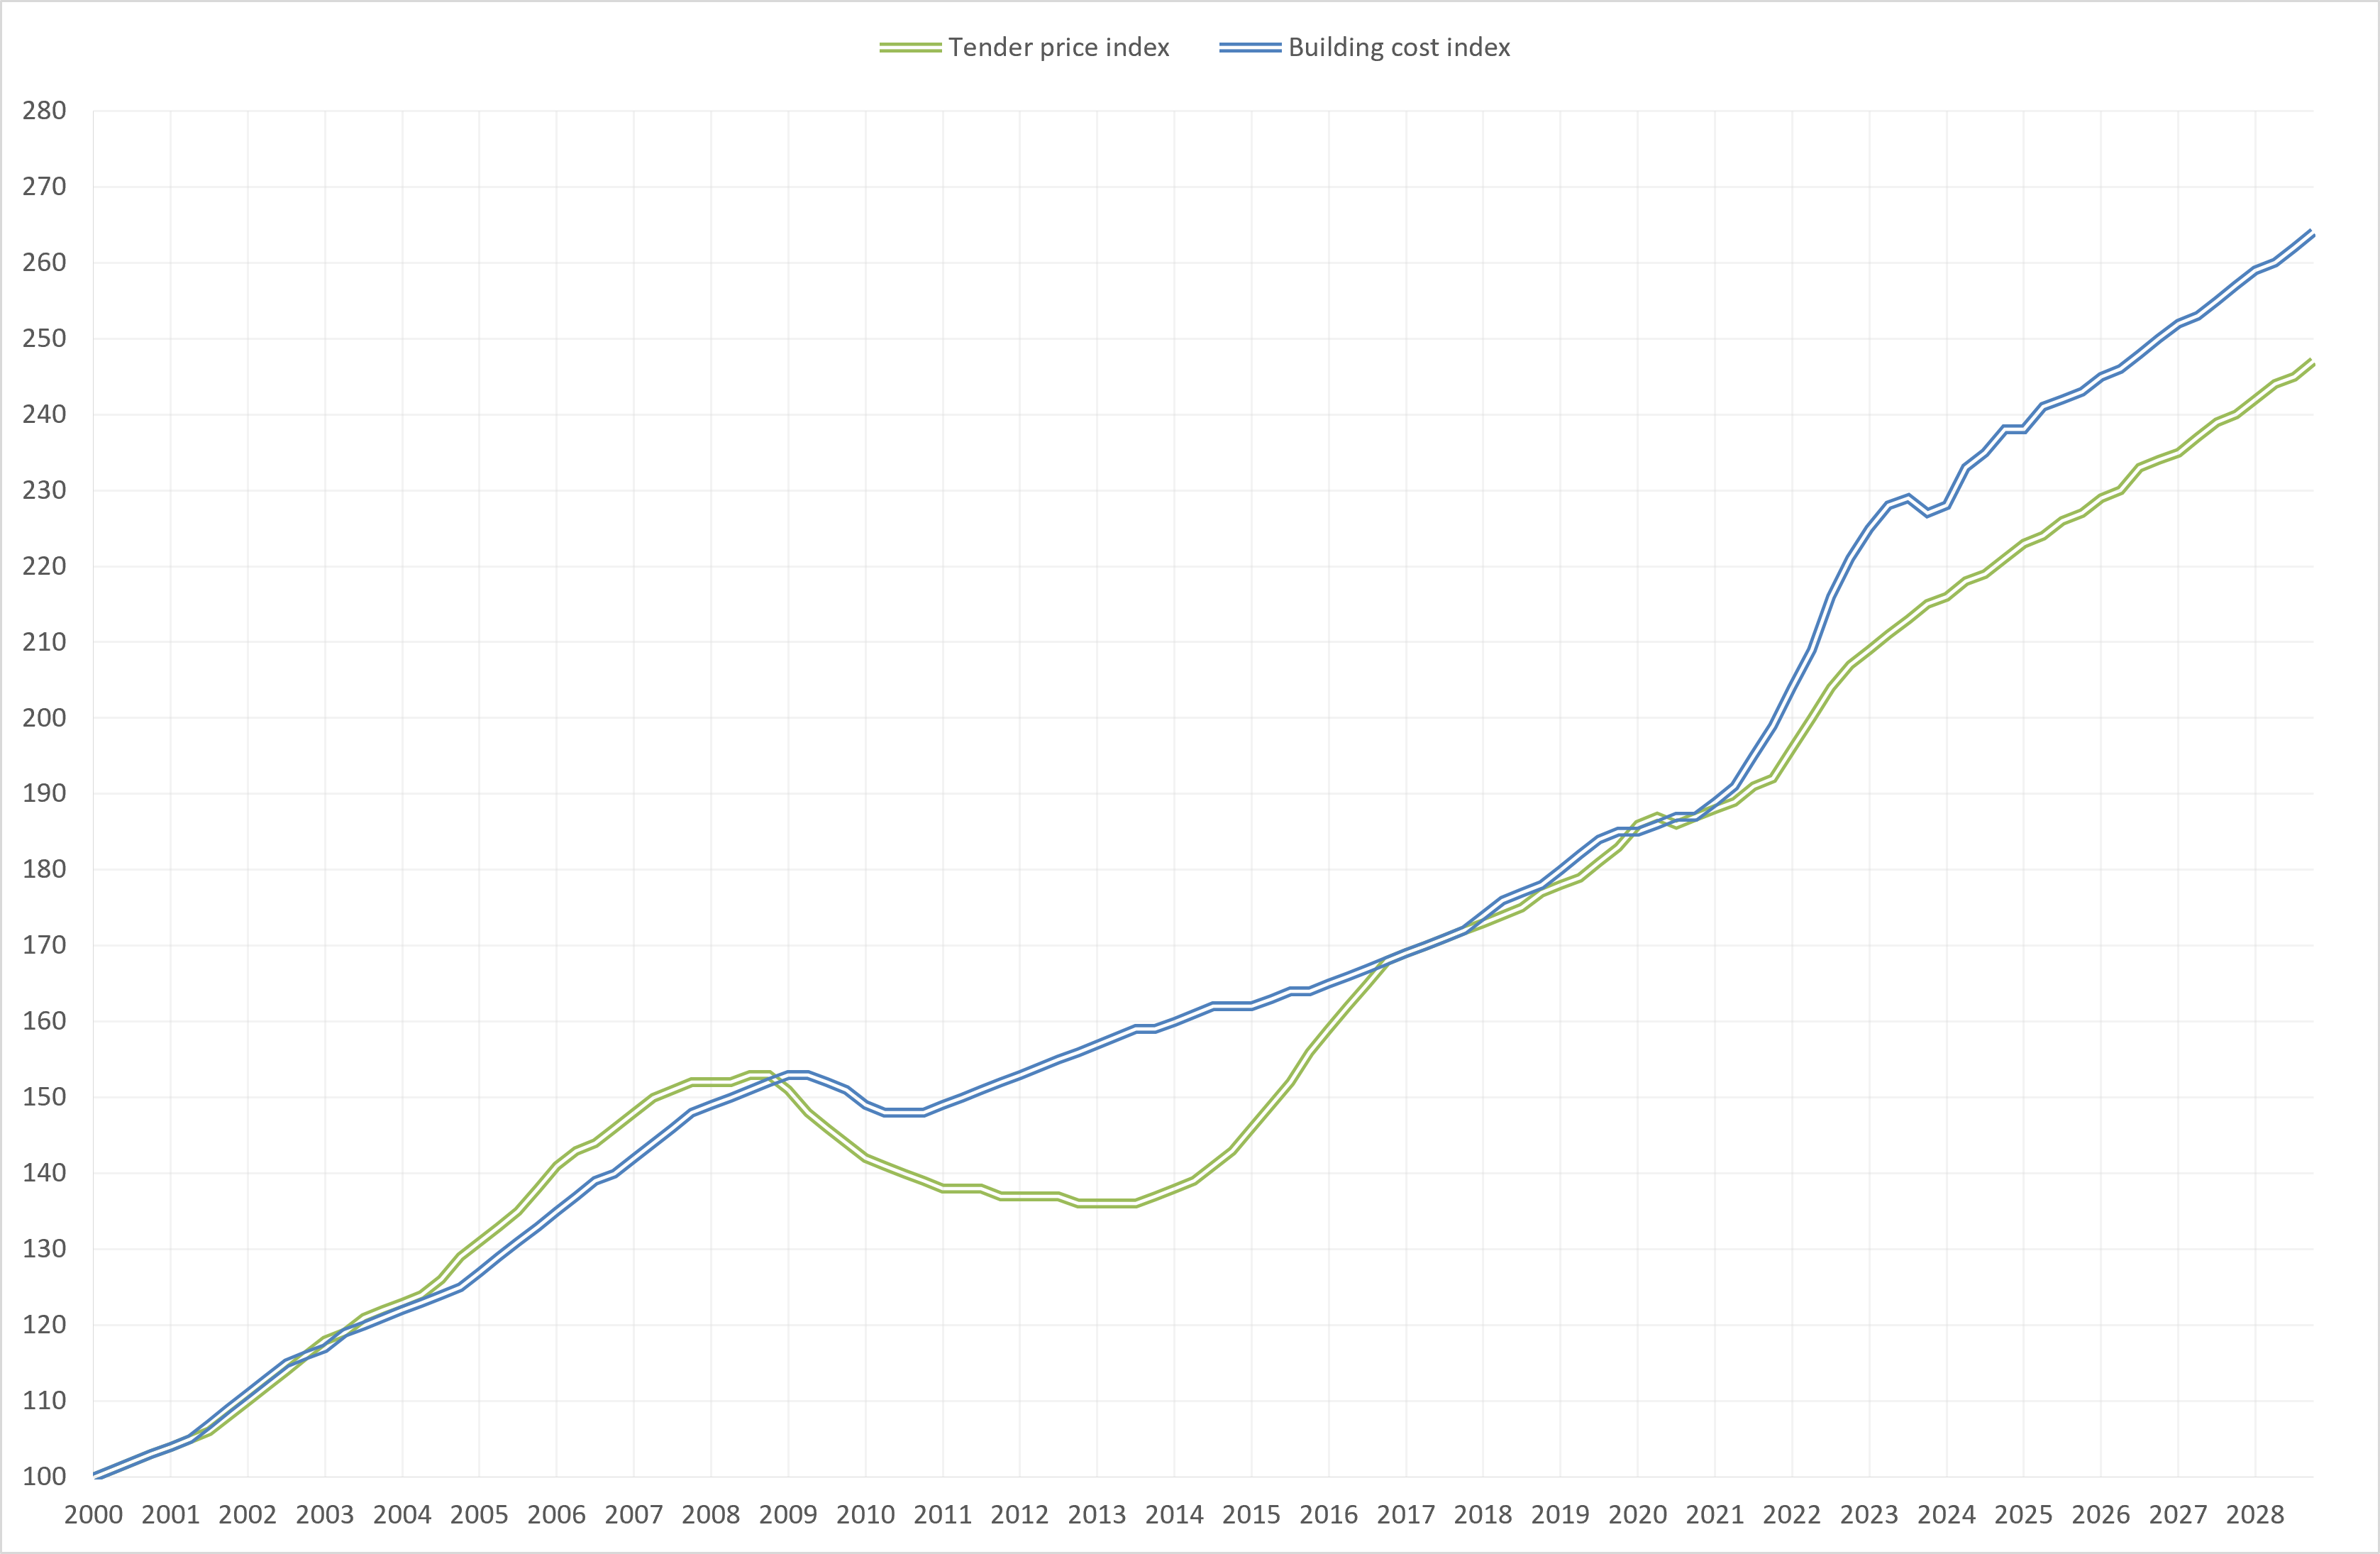
This page contains a chart and table of historic, current and forecasted UK tender price and building cost indices.
The indices given here are provided in good faith as an indicative guide only and should be used with understanding. You should also consider other sources of information. Costmodelling Limited cannot accept any liability for any work produced using these figures. You should always seek professional advice in producing costs for any construction project.
Please also be aware that some of these figures may change as more data becomes available, particularly the latter date figures when provisional data is superseded by more firm data.
The indices are based on Year 2000 = Index 100
Tender Price Indices index the price the client pays to have have a building project constructed. They can be used to update the cost of a building project, or obtained building contract price, from one time period to another time period. They are also normally used as a basis to calculate an allowance for future tender price inflation to include in a building project budget for the period from the base date of the budget to the proposed construction start date.
Building Cost Indices index the costs to the contractor in constructing the building, i.e. the building contractor's own internal costs. They mainly index the cost of construction labour and materials. They are normally used as a basis to calculate an allowance for future building cost inflation to include in a building project budget for the period from the proposed construction start date to the proposed construction completion date.
| Date | Tender price index | Building cost index |
| 2000 | 100 | 100 |
| 101 | 101 | |
| 102 | 102 | |
| 103 | 103 | |
| 2001 | 104 | 104 |
| 105 | 105 | |
| 106 | 107 | |
| 108 | 109 | |
| 2002 | 110 | 111 |
| 112 | 113 | |
| 114 | 115 | |
| 116 | 116 | |
| 2003 | 118 | 117 |
| 119 | 119 | |
| 121 | 120 | |
| 122 | 121 | |
| 2004 | 123 | 122 |
| 124 | 123 | |
| 126 | 124 | |
| 129 | 125 | |
| 2005 | 131 | 127 |
| 133 | 129 | |
| 135 | 131 | |
| 138 | 133 | |
| 2006 | 141 | 135 |
| 143 | 137 | |
| 144 | 139 | |
| 146 | 140 | |
| 2007 | 148 | 142 |
| 150 | 144 | |
| 151 | 146 | |
| 152 | 148 | |
| 2008 | 152 | 149 |
| 152 | 150 | |
| 153 | 151 | |
| 153 | 152 | |
| 2009 | 151 | 153 |
| 148 | 153 | |
| 146 | 152 | |
| 144 | 151 | |
| 2010 | 142 | 149 |
| 141 | 148 | |
| 140 | 148 | |
| 139 | 148 | |
| 2011 | 138 | 149 |
| 138 | 150 | |
| 138 | 151 | |
| 137 | 152 | |
| 2012 | 137 | 153 |
| 137 | 154 | |
| 137 | 155 | |
| 136 | 156 | |
| 2013 | 136 | 157 |
| 136 | 158 | |
| 136 | 159 | |
| 137 | 159 | |
| 2014 | 138 | 160 |
| 139 | 161 | |
| 141 | 162 | |
| 143 | 162 | |
| 2015 | 146 | 162 |
| 149 | 163 | |
| 152 | 164 | |
| 156 | 164 | |
| 2016 | 159 | 165 |
| 162 | 166 | |
| 165 | 167 | |
| 168 | 168 | |
| 2017 | 169 | 169 |
| 170 | 170 | |
| 171 | 171 | |
| 172 | 172 | |
| 2018 | 173 | 174 |
| 174 | 176 | |
| 175 | 177 | |
| 177 | 178 | |
| 2019 | 178 | 180 |
| 179 | 182 | |
| 181 | 184 | |
| 183 | 185 | |
| 2020 | 186 | 185 |
| 187 | 186 | |
| 186 | 187 | |
| 187 | 187 | |
| 2021 | 188 | 189 |
| 189 | 191 | |
| 191 | 195 | |
| 192 | 199 | |
| 2022 | 196 | 204 |
| 200 | 209 | |
| 204 | 216 | |
| 207 | 221 | |
| 2023 | 209 | 225 |
| 211 | 228 | |
| 213 | 229 | |
| 215 | 227 | |
| 2024 | 216 | 228 |
| 218 | 233 | |
| 219 | 235 | |
| 221 | 238 | |
| 2025 | 223 | 238 |
| 224 | 241 | |
| 226 | 242 | |
| 227 | 243 | |
| 2026 | 229 | 244 |
| 230 | 246 | |
| 233 | 248 | |
| 234 | 250 | |
| 2027 | 235 | 252 |
| 237 | 253 | |
| 239 | 255 | |
| 240 | 257 | |
| 2028 | 242 | 259 |
| 244 | 260 | |
| 245 | 262 | |
| 247 | 264 |
Below are various organisations, in alphabetical order, who publish UK construction market data: